
Describe your infographic *
AI Infographic Generator for Clear Visual Stories
Describe the topic, audience, facts, labels, and preferred structure. Generate an infographic with organized sections, visual hierarchy, and text layout.
Infographic examples
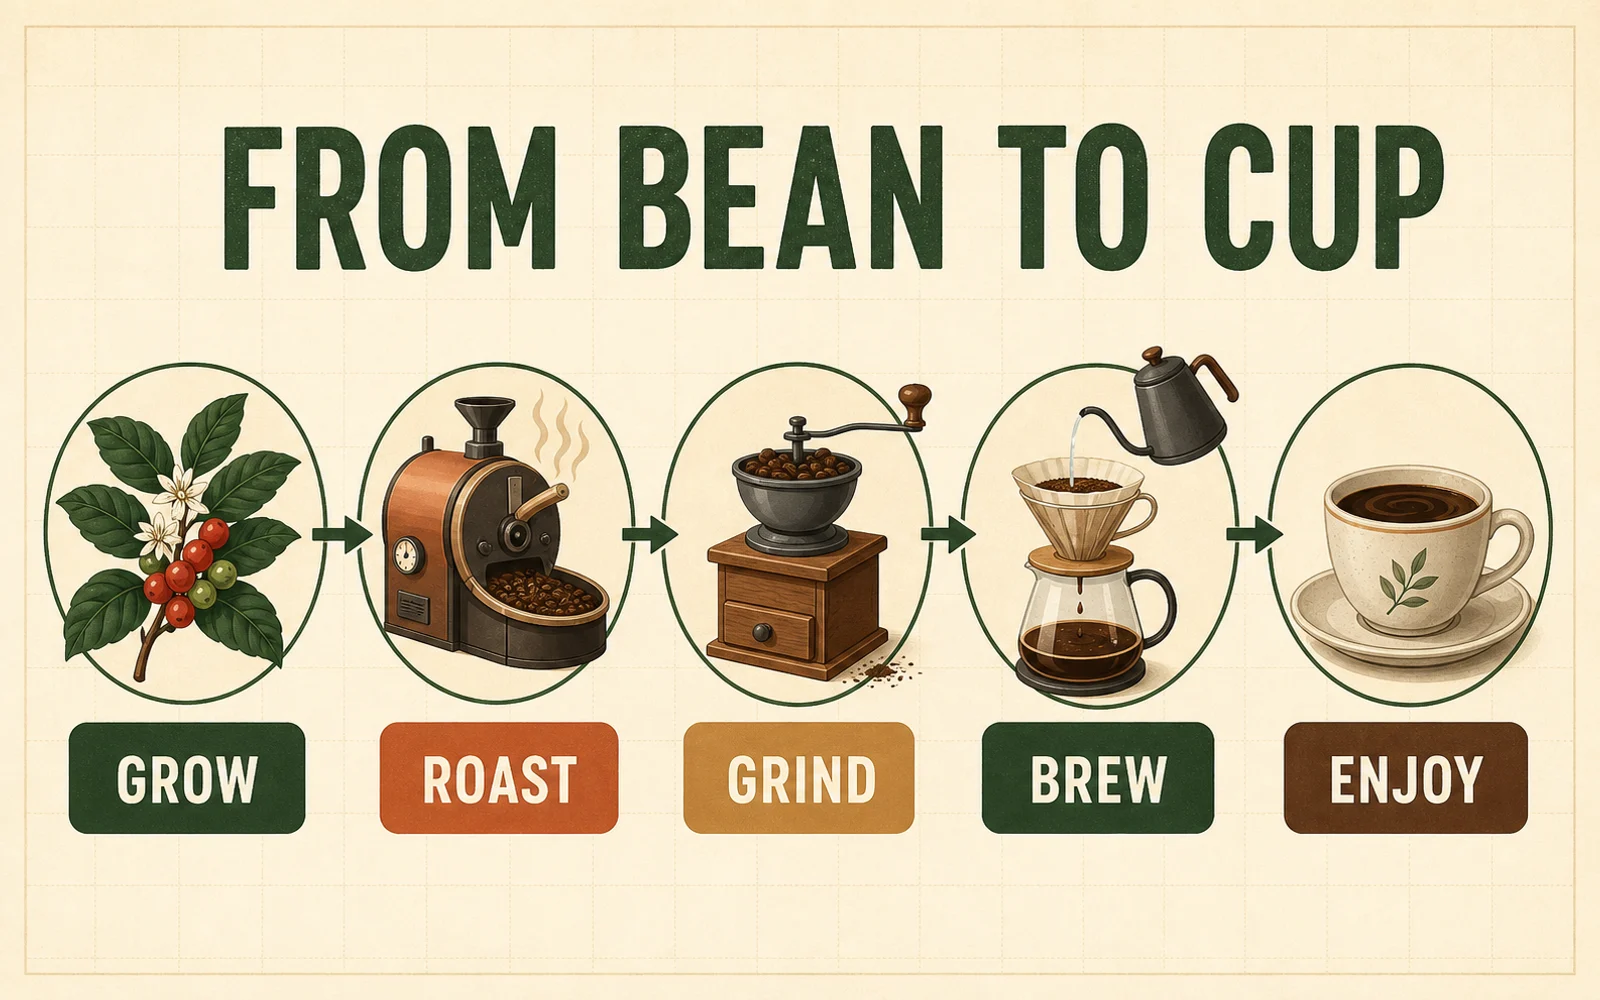
How to create an infographic with AI
Turn a topic, set of facts, or sequence of steps into a focused visual brief in four stages.
- 01
Define the reader and purpose
State who should understand the infographic and what they should learn, compare, remember, or do after viewing it.
- 02
Supply the source content
Include the facts, stages, labels, numbers, and exact wording that must appear. Keep the source material focused on one main message.
- 03
Name the visual structure
Ask for a process, timeline, comparison, checklist, cycle, hierarchy, or data summary, then describe the preferred colors and reading order.
- 04
Generate and review
Complete the available fields and generate the infographic. Check every label, number, arrow, and relationship before downloading or sharing it.
Choose a structure that fits your information
The same content becomes easier to follow when its visual format matches the relationship you want to explain.
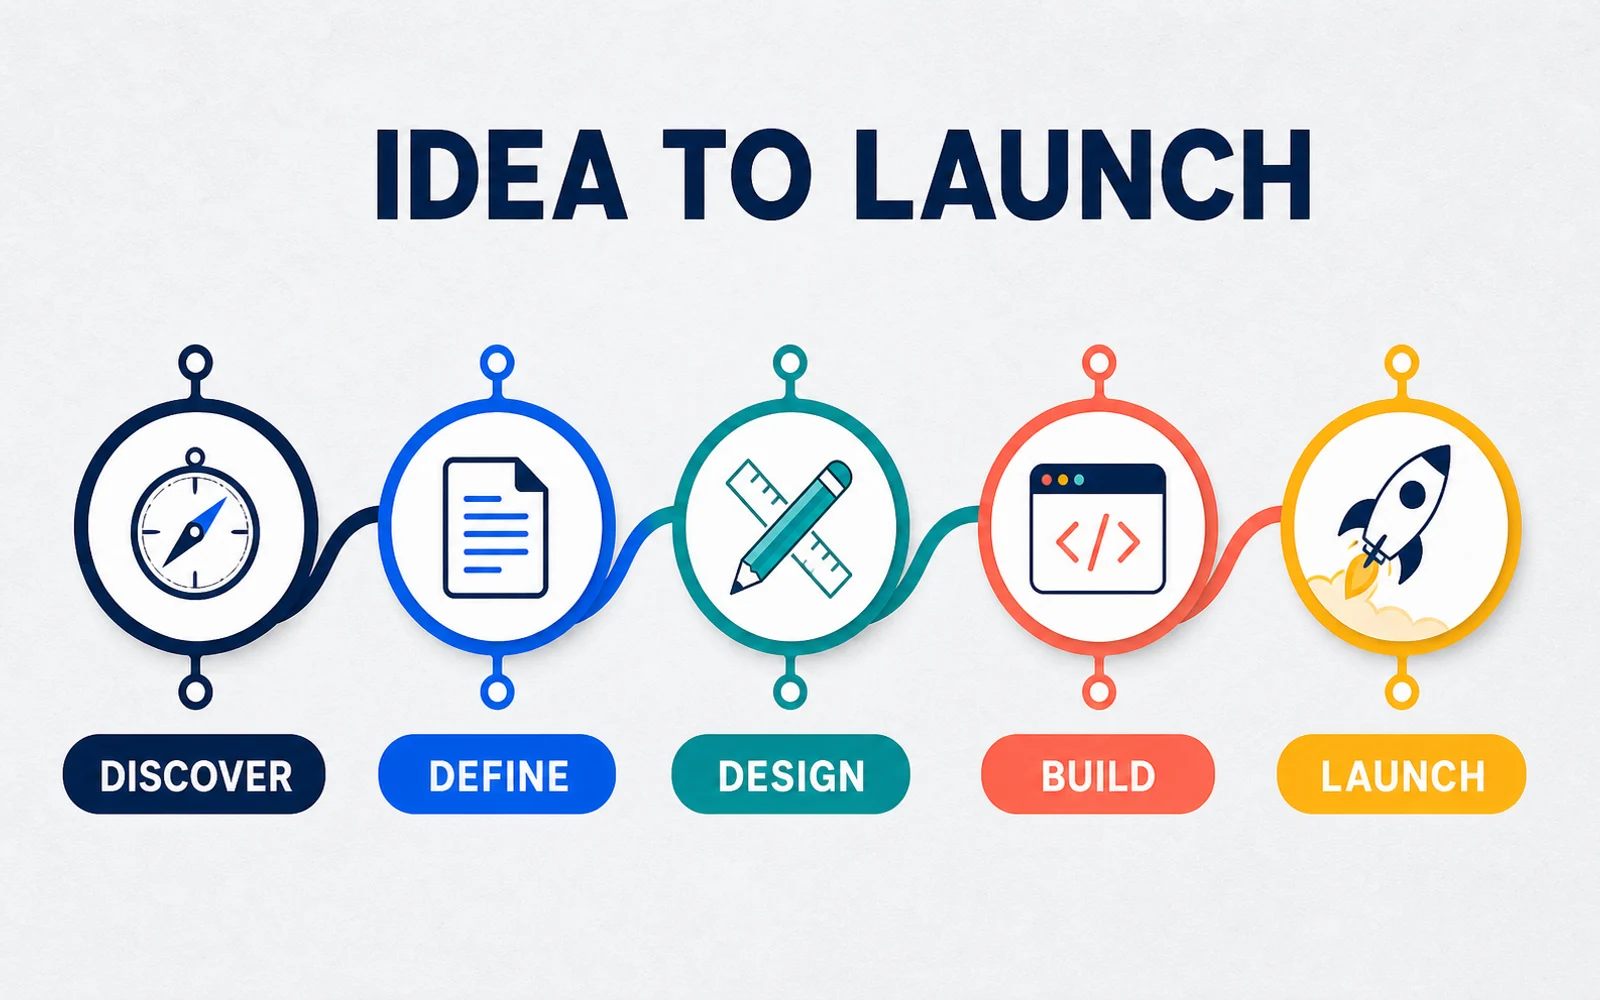
Turn milestones into a timeline
Use a timeline when order and progress matter. Provide the milestone names in sequence, keep each label short, and ask for one clear path from the starting point to the final outcome.
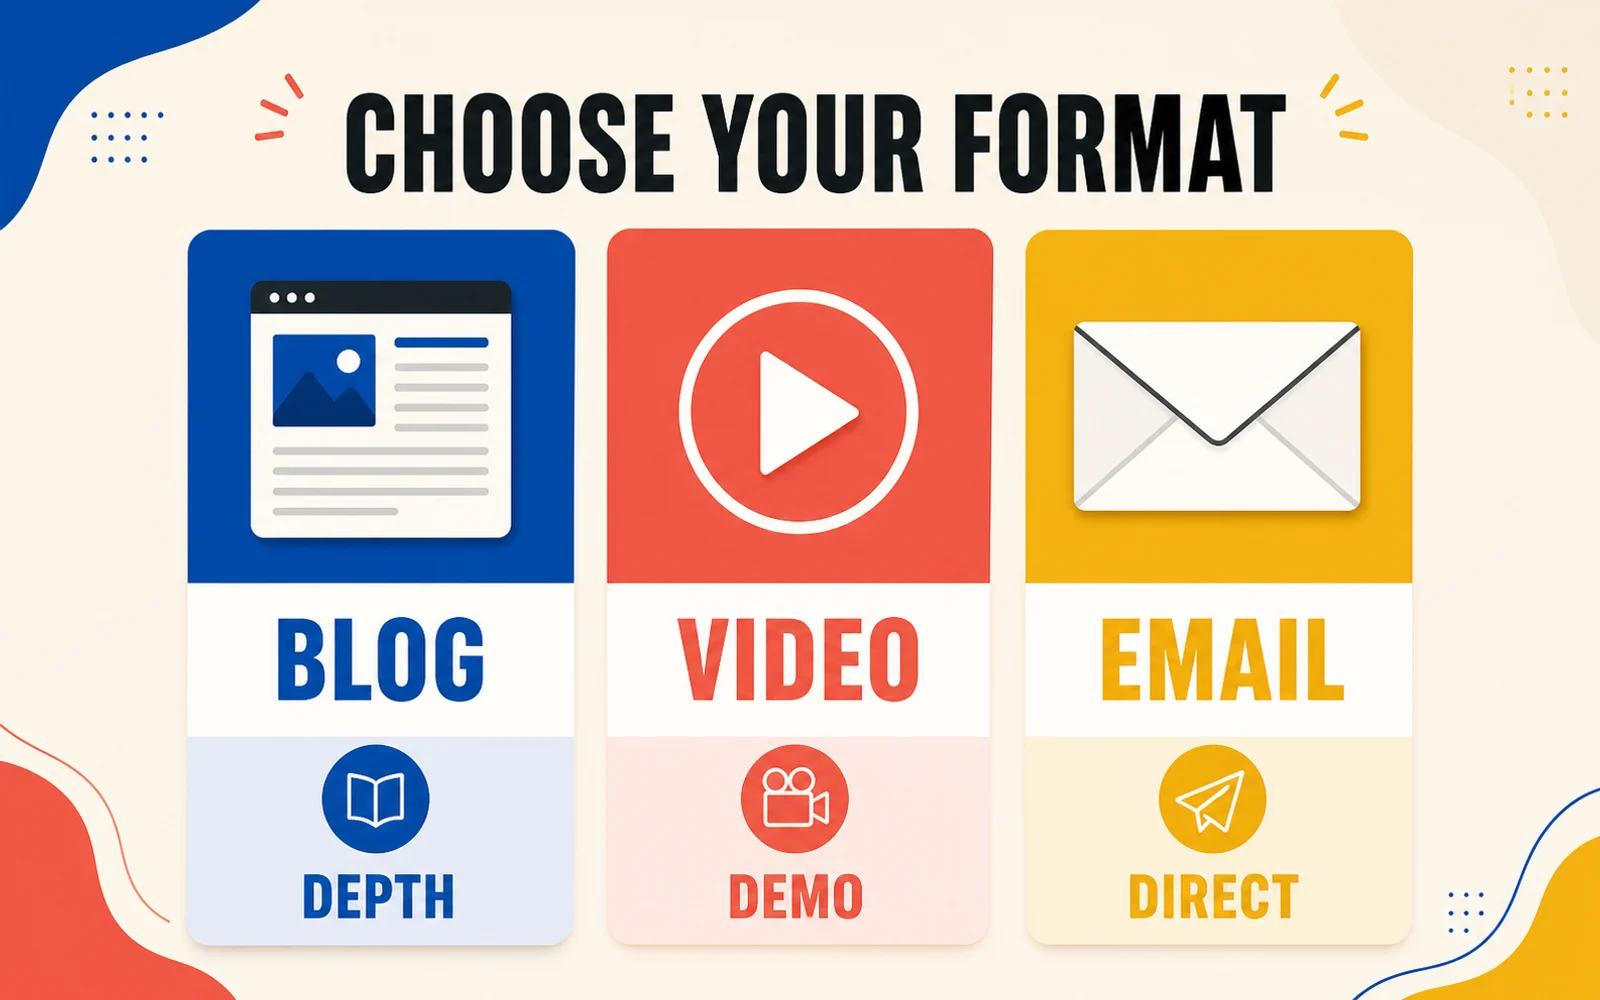
Compare options in parallel columns
A comparison layout works best when every option uses the same criteria. Name the categories, limit the number of differences, and keep the visual weight balanced so readers can scan across the page.

Package practical advice as a checklist
Turn recommendations into short, action-led items. Pair each instruction with one recognizable icon and arrange the cards in the order readers should follow or review them.
Write a stronger infographic prompt
Treat the prompt like a compact content brief: define what matters, what must appear, and how readers should move through it.
Lead with one takeaway
Choose the single idea the reader should remember. Supporting sections should explain that message instead of competing with it.
Provide exact labels
Put required titles, stage names, and short captions in quotation marks. Shorter labels are easier to place and review.
Explain the relationships
Say whether information flows in sequence, repeats in a cycle, branches into categories, or compares across shared criteria.
Verify every fact and character
Review spelling, numbers, units, dates, and arrow direction. Regenerate or edit the final artwork when anything is inaccurate or unclear.
Make information easier to scan
Ready to turn your content into an infographic?
Return to the generator, describe the message and structure, and create a visual draft you can review and refine.
AI Infographic Generator FAQ
Answers about infographic formats, prompts, source facts, generated text, accounts, and credits.
What is an AI infographic generator?
An AI infographic generator turns a written content brief into a structured visual draft with headings, labels, icons, diagrams, charts, or other layout elements suited to the topic.
What kinds of infographics can I create?
You can describe process diagrams, timelines, comparisons, checklists, educational cycles, data summaries, hierarchies, and other visual explanations.
What should I include in an infographic prompt?
Include the audience, main takeaway, source facts, exact title and labels, preferred structure, reading order, colors, and any icons or chart types that would help explain the content.
Can I include numbers and source data?
Yes. Provide the exact numbers, units, categories, and relationships you want shown. Always compare the generated result with your source before publishing it.
Will every generated label be spelled correctly?
Generated text can contain spelling or layout mistakes. Keep labels concise, specify important wording exactly, and review every character before using the infographic.
Do I need an account and credits to generate?
You can explore the examples and prepare your brief before signing in. The current credit cost appears on the generation control, and you will be asked to sign in when you generate.
Related paths
Explore related image tools
Explore another image step, check model options, or make the output move.

AI image tools
More image tools
Create, edit, clean up, or upscale stills.

AI models
Compare image models
Pick a better model before making more versions.

AI video tools
Make it move
Animate a still or turn it into a clip.
Text to Image
Prompt-first creation
Turn a written idea into an image.

AI Image Generator
Start from any idea
Create a fresh image from a prompt.

Social Media Banner Generator
Platform-ready banners
Create social headers, channel art, and campaign banners from a prompt.
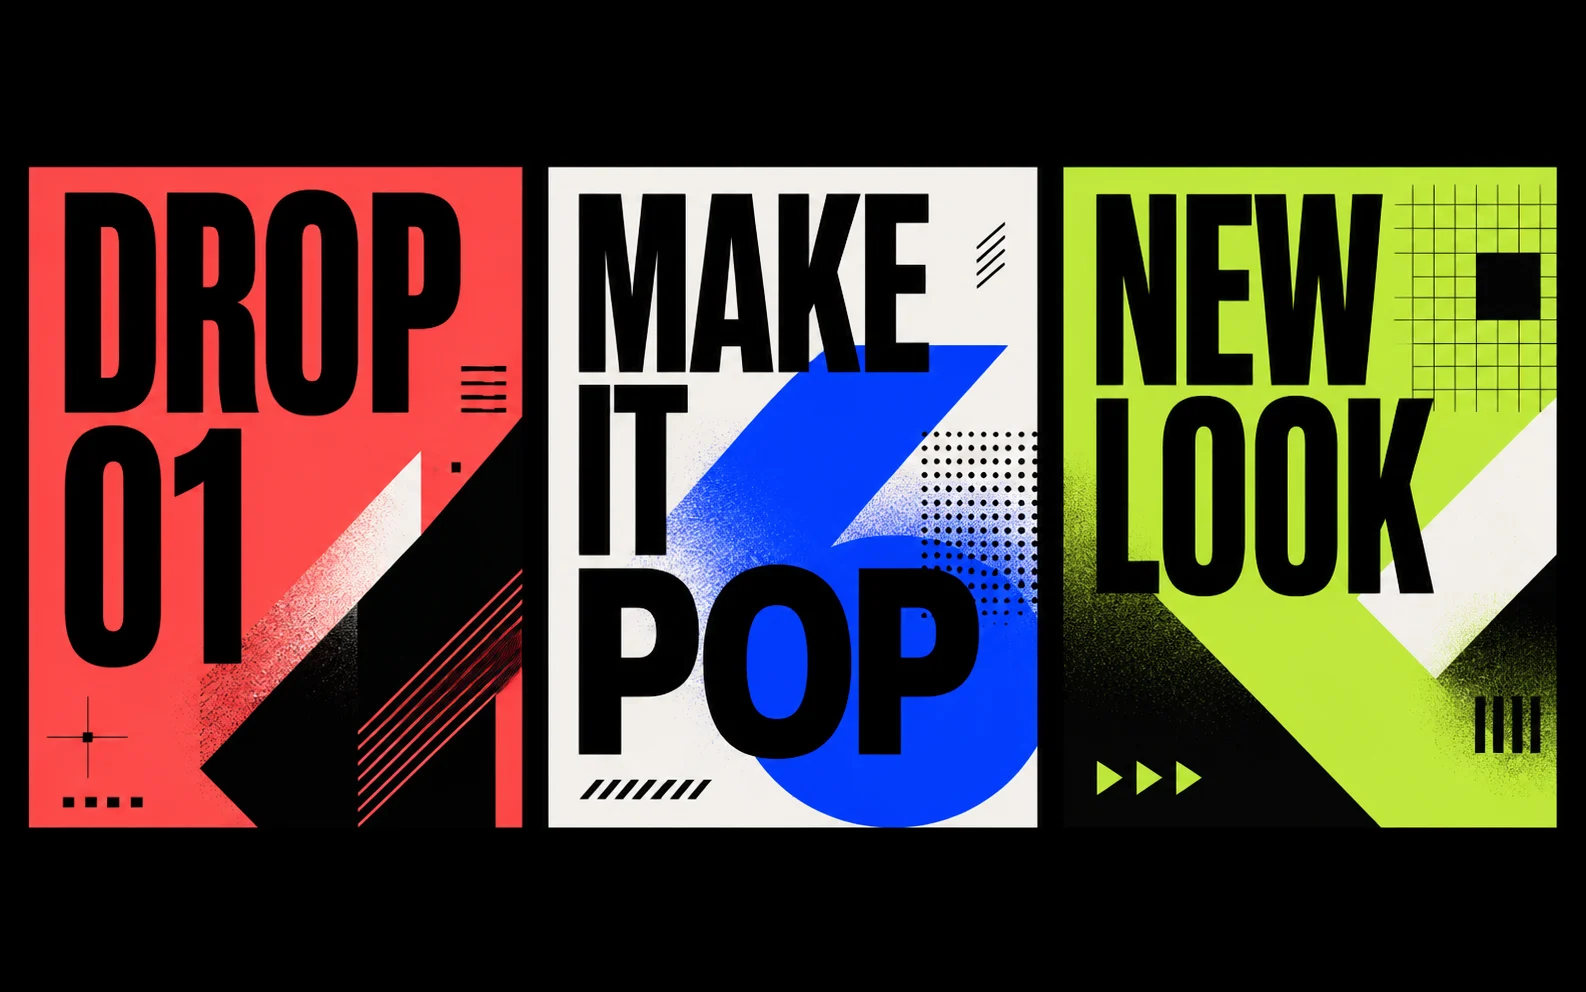
Social Media Post Generator
Social campaigns
Draft captions first, then create a matching post visual.
AI Logo Generator
Brand marks
Create logo ideas from a short brief.

AI Image Editor
Prompt-based edits
Change an image without starting over.
AI image tools
More image tools
Create, edit, clean up, or upscale stills.
AI models
Compare image models
Pick a better model before making more versions.
AI video tools
Make it move
Animate a still or turn it into a clip.
Text to Image
Prompt-first creation
Turn a written idea into an image.